
Distributed Systems
Why Your Server Falls Over Before the CPU Is Full.
By Muhammad UmarApril 19, 20268 min readIssue #16
Utilisation does not predict latency. Queueing does, and the curve between them is a cliff you cannot see from a dashboard.
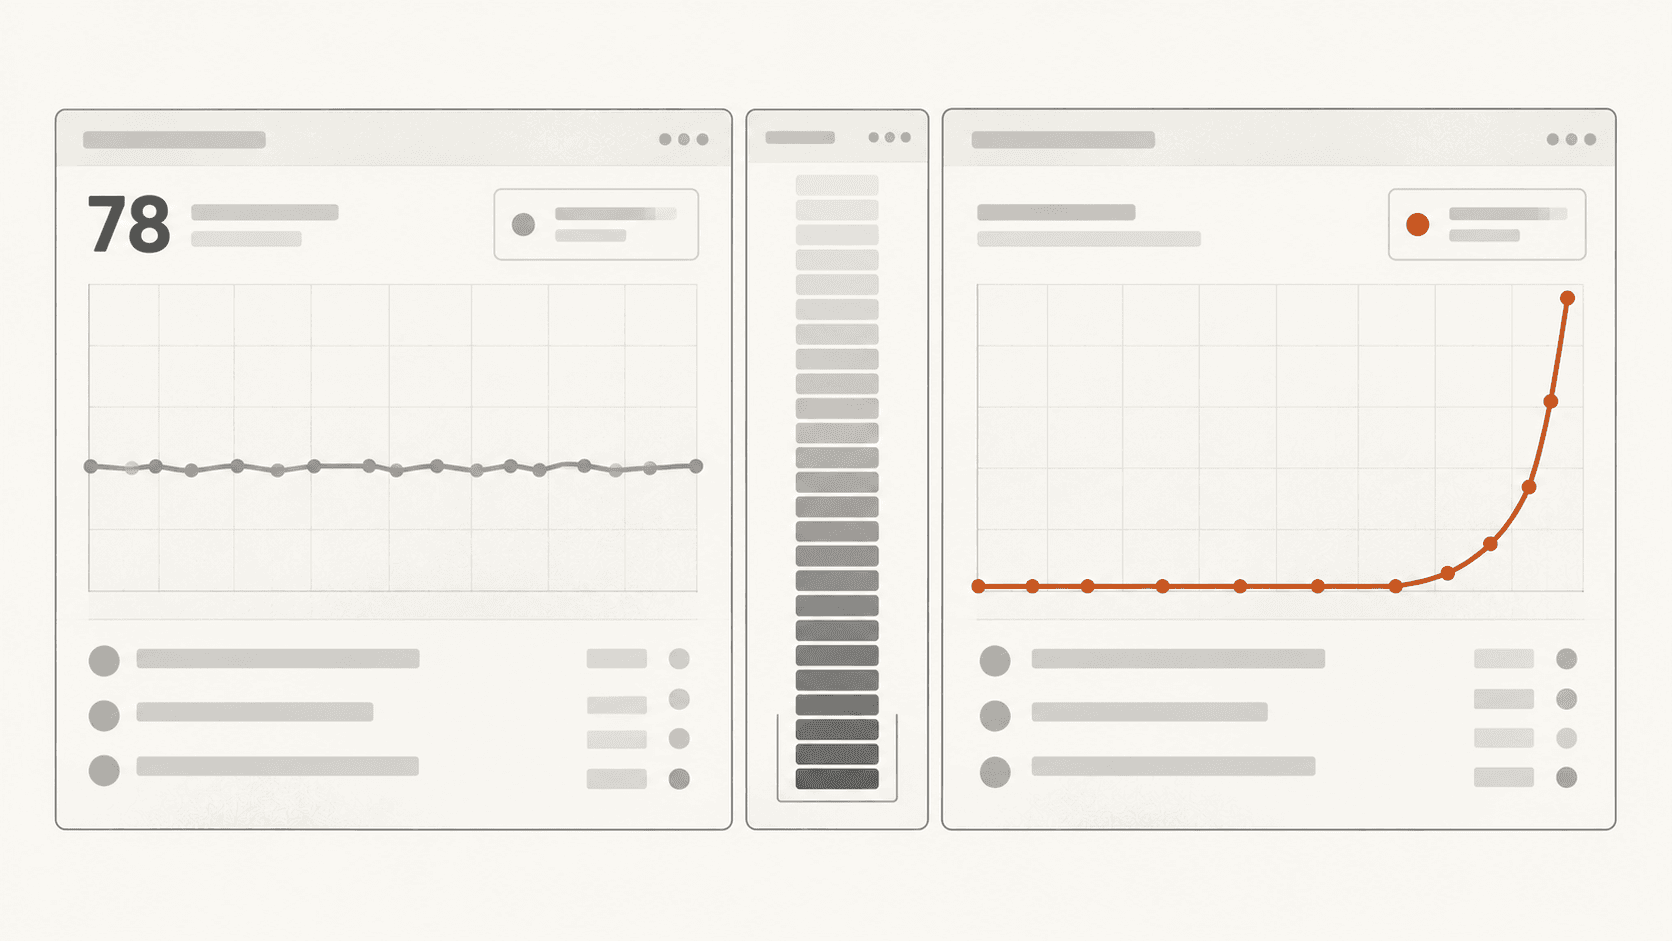
Traffic goes up by about five percent. Nothing else changes. No deploy, no config, no new feature.
Response times go from 40 milliseconds to four seconds, and the dashboard says the CPU is at 78 percent. There is a fifth of the machine sitting unused while requests pile up in front of it.
The usual explanation is that something hit a limit. A connection pool, a thread count, a file descriptor cap. Sometimes that is true. Very often nothing hit anything, and what you are looking at is ordinary queueing behaving exactly as the mathematics says it will.
Utilisation does not predict latency. They are related, and the relationship is not a straight line, and almost every capacity conversation assumes it is.
The problem: averages hide the queue
Stand in a supermarket for a minute and you already know this.
One till, and a customer takes two minutes to serve. If a customer arrives exactly every four minutes, there is never a queue. The till is busy half the time, and everybody walks straight up.
Now keep the same average and let people arrive when they feel like it. Still one every four minutes on average, but sometimes three turn up together and sometimes nobody comes for ten. The till is still busy half the time. But now there is sometimes a queue, because the three who arrived together have to be served one after another.
Nothing changed about capacity. What changed is that arrivals clumped, and a queue is what happens when a clump arrives.
Utilisation tells you how much of the hour the server was busy. It tells you nothing about whether the work arrived evenly.
Real traffic always clumps. Users act independently, so arrivals scatter rather than spacing themselves politely. That is the normal condition, not a bad day.
Where the idle capacity goes
Here is the part that makes the dashboard misleading.
Idle time is what lets a server recover from a clump. Three requests arrive at once, the server works through them, and the gap that follows is when the queue drains back to nothing.
At 50 percent busy there is plenty of gap. At 90 percent busy the gaps are small, so a queue formed by one clump has barely drained before the next clump arrives. The queue starts each burst from a length it inherited rather than from zero.
Spare capacity is not waste. It is the mechanism by which queues clear, and when you tune it away the queue stops clearing.
The shape of the curve
For the simplest model of a queue, with random arrivals and one server, the average time a request spends waiting works out proportional to ρ / (1 - ρ), where ρ is the fraction of time the server is busy.1
You do not need the derivation. You need what the fraction does as the bottom approaches zero.
| Busy | Average wait, in service times | What one more point of load costs |
|---|---|---|
| 50% | 1 | almost nothing |
| 70% | 2.3 | a little |
| 80% | 4 | noticeable |
| 90% | 9 | a lot |
| 95% | 19 | double the previous row |
| 99% | 99 | the incident |
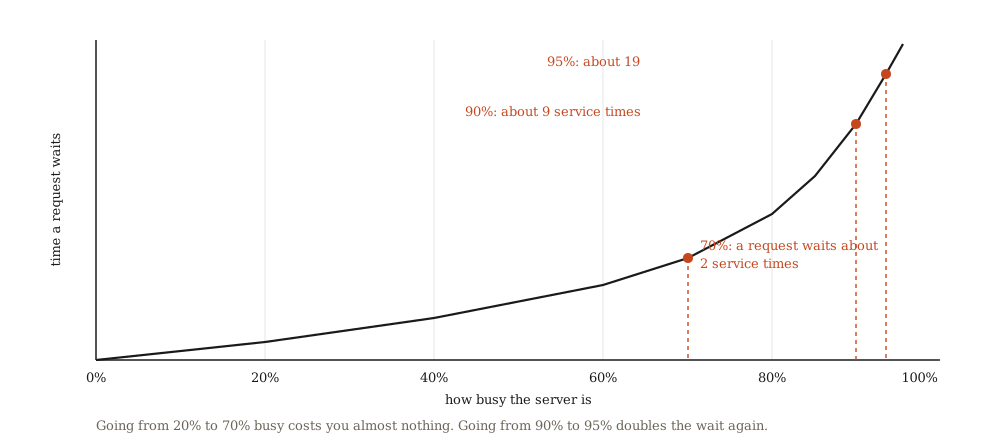
Look at what that shape does to your intuition. Between 20 and 70 percent, adding load is nearly free, and every experience you have had of scaling has taught you that adding load is nearly free. The lesson generalises right up until it stops.
Then a five percent traffic increase moves you from 90 to 95, and the wait doubles. The traffic change was small. The position on the curve was not.
Variability is the second dial
Utilisation is not the only input. There is a well-known approximation for more realistic queues showing waiting time as roughly that same ρ / (1 - ρ) term multiplied by how variable the arrivals and the service times are.2
That second factor matters because it is often the one you can actually change. If every request takes about the same time to serve, the multiplier is small. If most take 5 milliseconds and a few take 3 seconds, it is large, and the slow ones park in front of everything behind them.
Which explains a failure people misdiagnose constantly. One endpoint gets slow, and endpoints that share the same workers get slow with it, despite doing nothing expensive themselves. They are not broken. They are behind something.
What to actually do
Run at a utilisation that leaves slack
The first move is to stop treating high utilisation as efficiency. On the curve above, the flat region ends somewhere around 70 percent for a single queue, and the exact number depends on how variable your workload is.
A server at 50 percent is not half wasted. It is holding the room a queue needs in order to drain.
Wrong when the cost of that idle capacity is genuinely the constraint. Batch work, analytics, video encoding, anything where nobody is waiting on the other end, should run hot. There is no queue for a human to stand in.
Cut the variability before you buy hardware
Because variability multiplies the whole thing, removing your slowest outliers can do more than adding a machine, and it costs nothing to run afterwards.
- Move expensive work off the request path into a queue the user is not standing in.
- Give slow endpoints their own workers, so they cannot block the fast ones.
- Put a timeout on everything, so one pathological request cannot hold a worker indefinitely.
- Cap how much work a single request can ask for, since unbounded result sets are where long tails come from.
Wrong when the variability is inherent to the work. Some requests really are a hundred times larger than others, and pretending otherwise produces artificial limits that users then work around in worse ways.
One queue, several servers
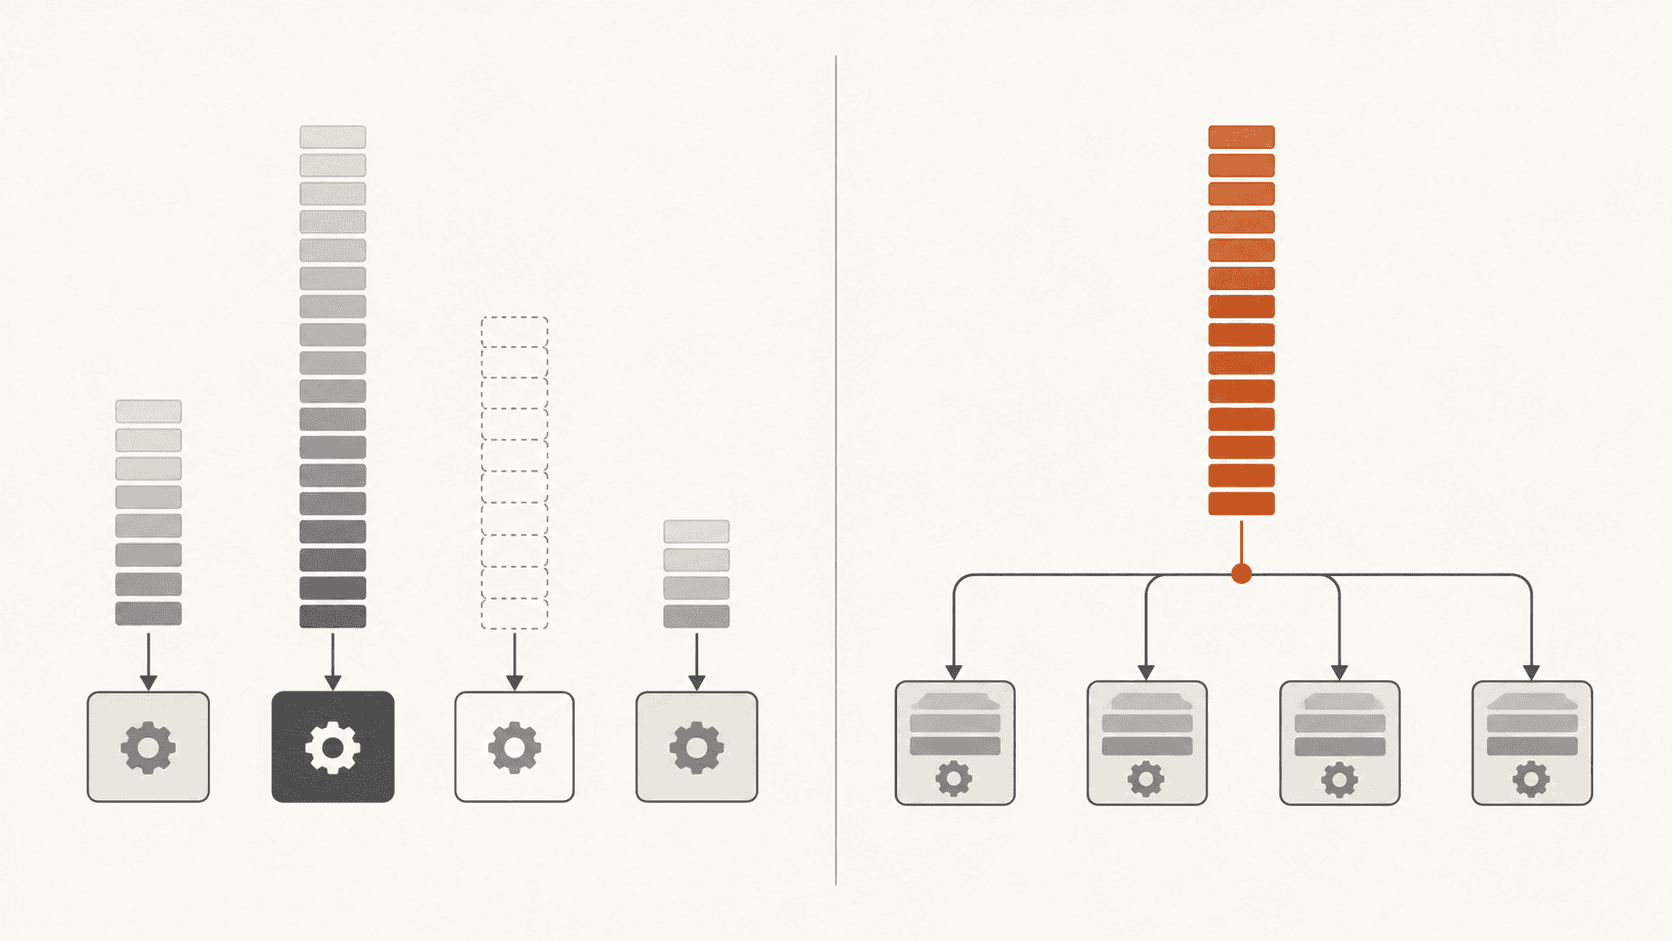
Supermarkets have a queue per till. Banks have one queue feeding several counters. The bank is right, and the reason is on the curve.
With separate queues, you can be stuck behind one slow customer while a neighbouring till stands empty. That idle capacity is unreachable, and unreachable slack does not drain your queue.
One shared queue lets every server absorb every clump, which is why a load balancer that hands the next request to whichever worker is free beats one that assigns requests to workers in advance.
Wrong when requests need affinity to a particular server, for a warm cache or a held session. Then you are choosing locality over pooling, which can be correct, and you should know that is the trade you made.
Refuse work rather than queueing it
Past a certain point a queue is not a buffer, it is a place requests go to time out. If a request has waited 30 seconds and the client gave up at 10, serving it consumes capacity to produce a response nobody will read.
Bounding the queue and rejecting arrivals once it is full is the honest behaviour. A fast refusal lets the caller retry somewhere else or show an error, and it keeps the queue short enough that the requests you did accept still complete in time.
Wrong when rejection costs more than the delay. For a payment or a checkout, a slow success may be worth far more than a quick failure, and a bounded queue turns degraded service into lost revenue.
| Change | Moves | Costs | Skip when |
|---|---|---|---|
| Target lower utilisation | You down the curve | Hardware you are not fully using | Nobody is waiting on the result |
| Reduce variability | The multiplier on the whole formula | Engineering time, no runtime cost | The spread is inherent to the work |
| Pool into one queue | Idle capacity to where the queue is | Loses server affinity | Requests need a warm local cache |
| Bound the queue and shed | Failures forward, out of the tail | Some requests refused outright | A slow success beats a fast failure |
Why the dashboard did not warn you
Three reasons, and they compound.
CPU is averaged over a window. A minute at 78 percent can be many short intervals at 100 percent with gaps between them. The queue forms during those intervals, and the average never shows one.
Averages hide the tail. Mean response time stays respectable long after the 99th percentile has gone bad, and the 99th percentile is where the queue lives. If you watch one number, watch that one.
Queue depth is usually not on the dashboard at all. It is the most direct signal available and most systems never chart it. A queue that is short and stays short is healthy at any utilisation, and a queue that is growing is in trouble regardless of what the CPU says.
When this is the wrong advice
When there is no queue. All of this describes work waiting for a resource. A stateless service comfortably under capacity with a proper load balancer may simply never queue, and adding headroom to it buys nothing.
When the real limit is a hard one. Sometimes something genuinely did hit a wall: a connection pool at maximum, a memory ceiling, a rate limit at a provider. Those look similar from the outside and the fix is different, so check for a saturated resource before reasoning about curves.
When the numbers here are treated as thresholds. The table is a model with assumptions that your system does not meet exactly. It tells you the shape, which is what matters. Treating 70 percent as a rule rather than measuring your own knee will give you a number that is confidently wrong for your workload.
The takeaway
The reason a five percent traffic increase can end an evening is that the relationship between load and latency is a cliff and you cannot see where you are standing on it from a utilisation number.
So the useful question about your own system is not how busy it is. It is how much traffic would it take to double the wait? If the answer is a small number, you are already on the steep part, and everything looks fine right up until it does not.
Sources
- Leonard Kleinrock, Queueing Systems, Volume 1: Theory, Wiley 1975. The standard treatment of the single-server queue, where mean response time works out as one service time divided by one minus utilisation.
- J. F. C. Kingman, The single server queue in heavy traffic, Mathematical Proceedings of the Cambridge Philosophical Society, 1961. The approximation showing waiting time as a utilisation term multiplied by a variability term.